Maxwell-Boltzmann Distribution
The particles in any solution or gas are all moving at different speeds. The amount of energy a particle has is dependent on its speed; this means that there is a range of energies in solutions and gases. These range of energies give us a curve when energy E is plotted against the fraction of particles with energy E.
The Maxwell-Boltzmann Distribution says that:
For a reaction to take place, particles need to have at least the activation energy to collide successfully and cause a reaction. The activation energy (Ea) can be shown on the Maxwell-Boltzmann Distribution Curve. The area under the graph to the right of the Ea line represents the number of particles with sufficient energy to react.
The Maxwell-Boltzmann Distribution curve shows the distribution of energy among particles within a solution or gas and can also show the number of particles with the activation energy. Below is a diagram showing the Maxwell-Boltzmann Distribution Curve.
The particles in any solution or gas are all moving at different speeds. The amount of energy a particle has is dependent on its speed; this means that there is a range of energies in solutions and gases. These range of energies give us a curve when energy E is plotted against the fraction of particles with energy E.
The Maxwell-Boltzmann Distribution says that:
- no particles have zero energy.
- most particles have intermediate energies.
- a few have very high energies.
- the average energy is not the same as the most probable energy.
For a reaction to take place, particles need to have at least the activation energy to collide successfully and cause a reaction. The activation energy (Ea) can be shown on the Maxwell-Boltzmann Distribution Curve. The area under the graph to the right of the Ea line represents the number of particles with sufficient energy to react.
The Maxwell-Boltzmann Distribution curve shows the distribution of energy among particles within a solution or gas and can also show the number of particles with the activation energy. Below is a diagram showing the Maxwell-Boltzmann Distribution Curve.
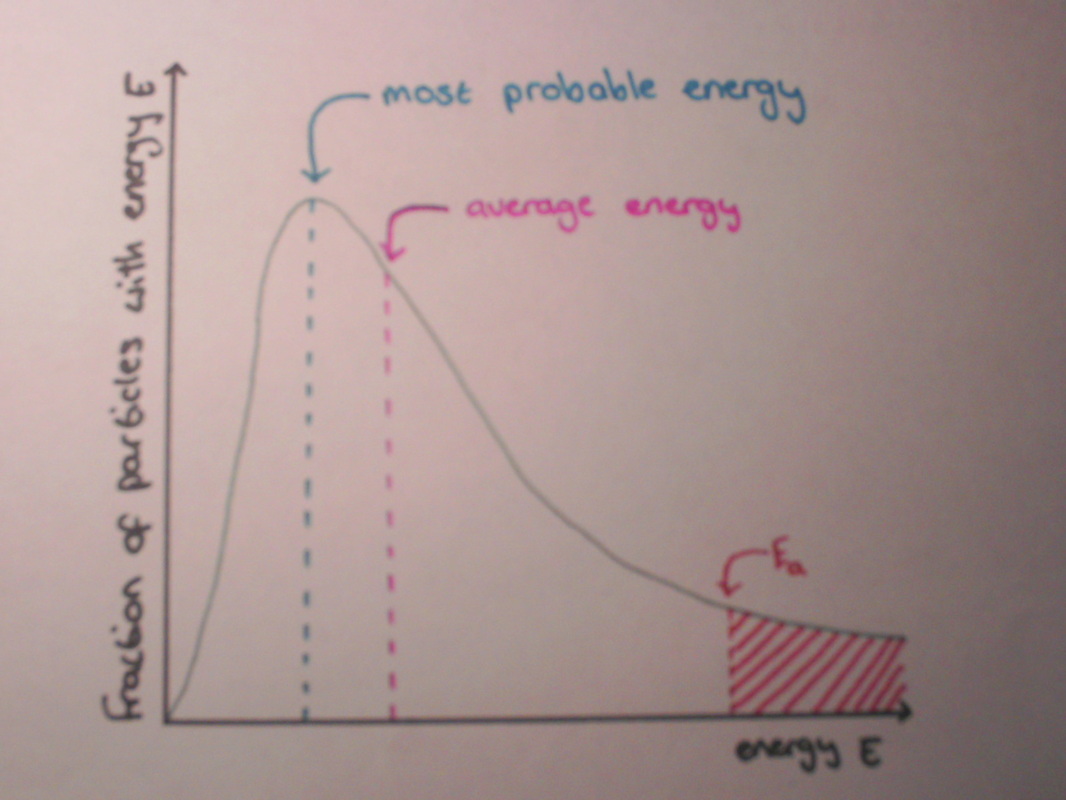
The Maxwell-Boltzmann Distribution Curve showing the most probable energy, the average energy, the activation energy and the number of particles with sufficient energy to react (area to the right of the Ea line).
The effect of temperature on the reaction rate
When the temperature is increased the peak of the curve is lower and shifts to the right. This increases the number of particles with very high energy, However the area under the curve remains the same as there is the same number of particles.
The graphs below shows how the Maxwell-Boltzmann Distribution Curve changes when the temperature is increased. It shows that there are more particles with a greater energy than Ea at T2 than T1 when T2 > T1.
